
IT4© generates maps automatically without any effect of drawing. IT4© ensures the description and consolidation of IT systems maps in a common repository. From this information, powerful predefined analyses can be carried out to identify rationalization options, and preview the impact of change. This facilitates the governance of IT Assets and supports overall enterprise architecture initiatives.
What Solutions We Offer
IT4© offers the following functionalities.
Deploy a common repository of your infrastructures servers, databases, applications, (CI or Configuration Items), including the configurations, the number of users, etc, as well as the details of the relations which link all these objects. Each object is equipped with all parameters necessary to its definition, its identification and its operation. This collection of parameters can be enriched along the time.
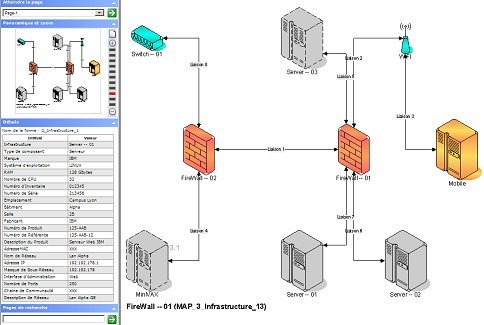
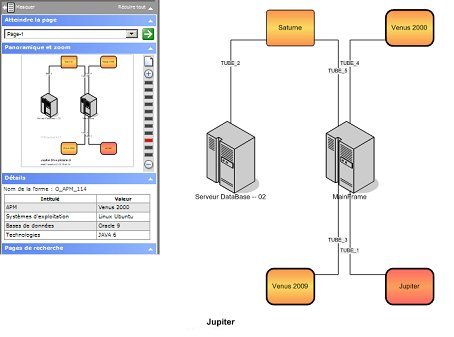
Immediately visualize the links between your elements, your applications and reach all their features
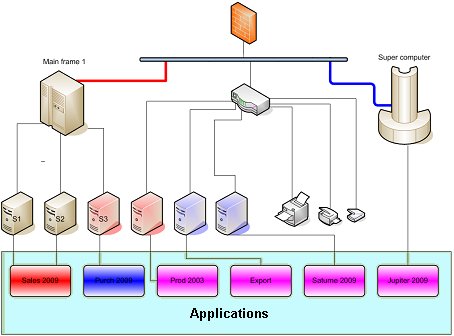
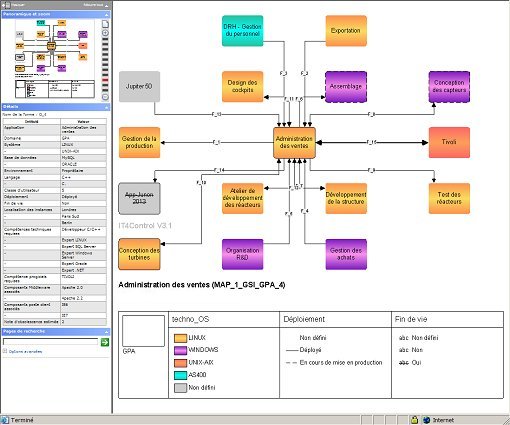
Analyze the links between an application and its neighbors and get a map of the applications and elements of infrastructure (CI)
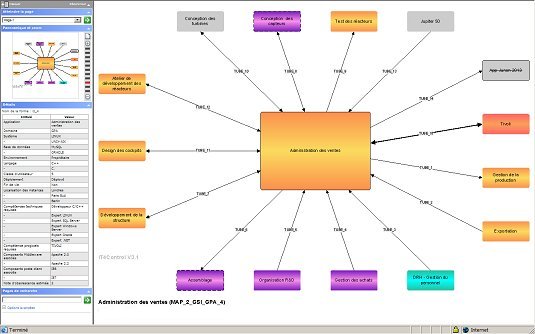
The map depth order analyzes can be adjusted (order 1: the application and its closest neighbors, order 2: with the closest neighbors of closest neighbors etc)
IT4© makes it possible to design all objects types which you need. A certain number of objects are proposed as a standard like the actors, the company organization levels or directions, departments etc, processes, applications, projects, servers, mainframes etc.
All the objects created are inter-connected by relations which are also objects being able to contain other objects.
Graphic visualization in the form of maps is entirely automatic. There is no need for to redraw a chart when this one evolved/moved. The system takes care itself of the updates and the recalculation of the drawings.
The type of routing of the drawings can be selected: radial routing, automatic routing, no routing…
All the maps thus generated are exportable in a standard format (Microsoft VISIO 2010) and can then be recovered on the cient station of the person in charge of the maps management. This last one can work on this page layout, and reinject it on the server by asking its page layout work to be memorized and taken into account at the time of the next automatic update.
If the automatic calculation of the maps is an undeniable advantage and a considerable time-saver, it is also possible to create a personal map and then to reinject it on the server.
During the generation of map layout, the system also calculates all hyper link for navigation. Then, it is easy to move from a map to another map by simple click.
A particular care was taken to management styles objects. A screen dedicated to styles association allows you to configure quickly and easily the way in which you want to draw your objects (servers, applications etc) according to some properties of these objects. One thus can, by xemple, to associate a style of filling (color, reason, convex form) according to the type of technology used by an application, to associate a type of feature for the layout of this form according to another property and finally to also work the label of object according a third property.
Finally, the IT4© solution offers many parameters making it possible to manage what you want to see and how you want to represent it. All these adjustments are memorized within a map /configuration. It is possible to create as many configurations as wished. For example, one can imagine the map of financial management, the map of the sales management, the map of all the /applications belonging to the ERP domain etc, while varying styles of representation.
All the objects bound by relations can be charted. One can thus create a map of the processes, a map oriented to urbanization cut out in zones, domain, blocks etc